Utilization as Survey Data
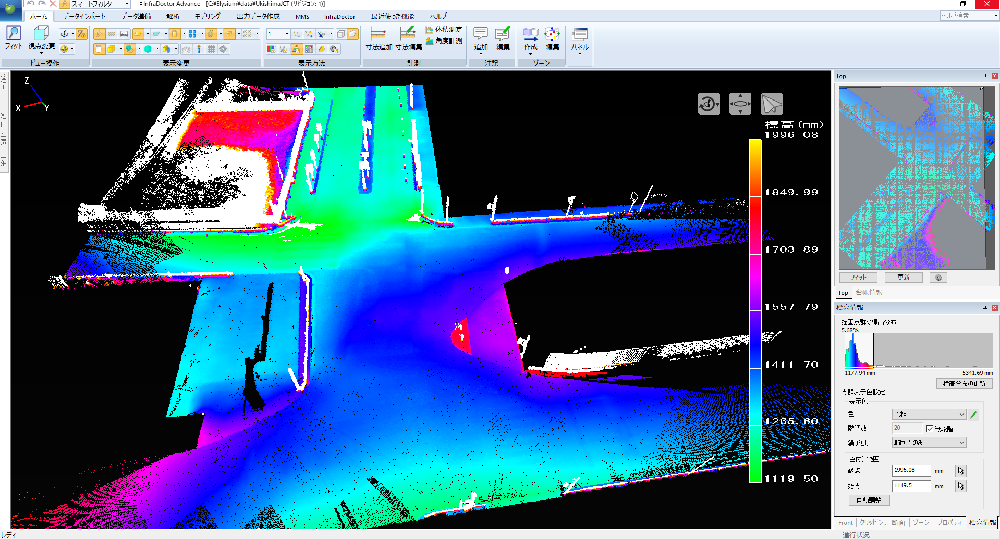
Example (1): Surveying road surface conditions in areas prone to water pooling
Road Slope Measurement and Survey
Using the height display function of InfraDoctor® ADVANCE, you can easily grasp the road's slope
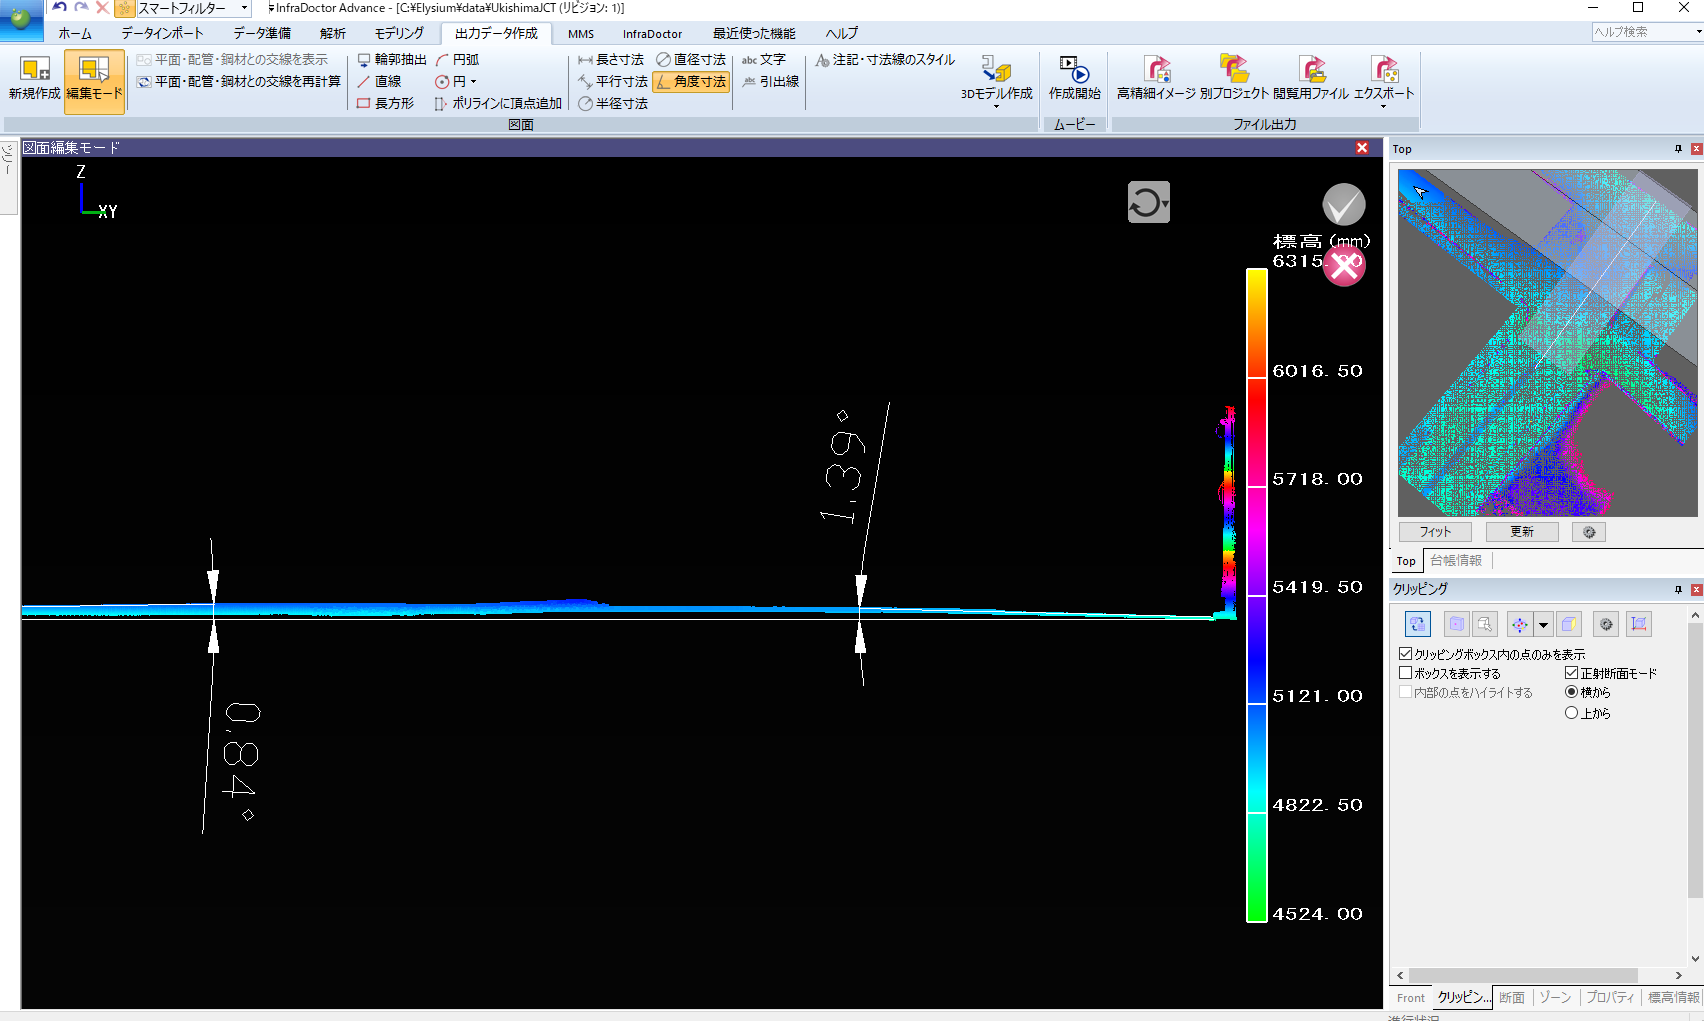
Example (2): You can create cross-sections from point cloud data to accurately understand the road surface slope
The height display color map can be freely customized.
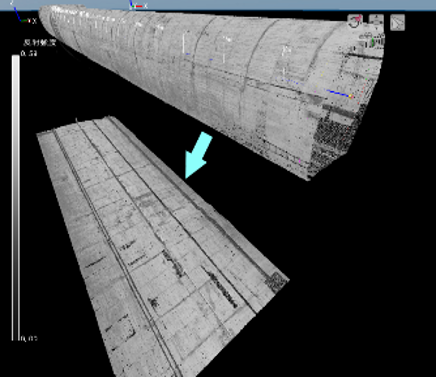
(Image 1) Unfolding and analyzing a tunnel
Roughness Analysis and Deformation Detection
Analyzes the condition of walls, road surfaces, etc
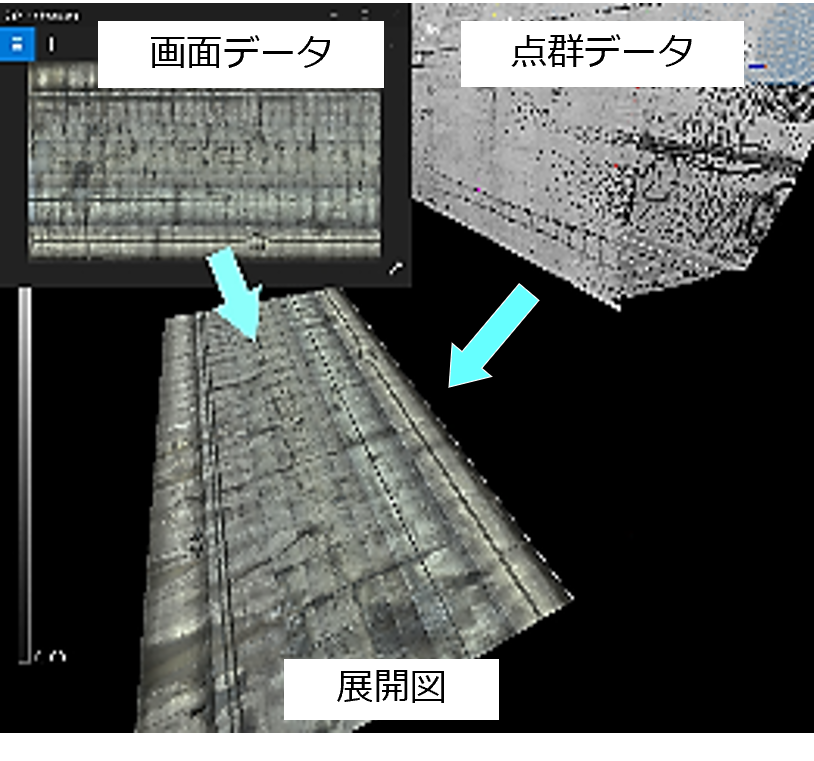
InfraDoctor®ADVANCE has a function to unfold and display point clouds of tunnels. It can be flattened without distortion even in curved sections.
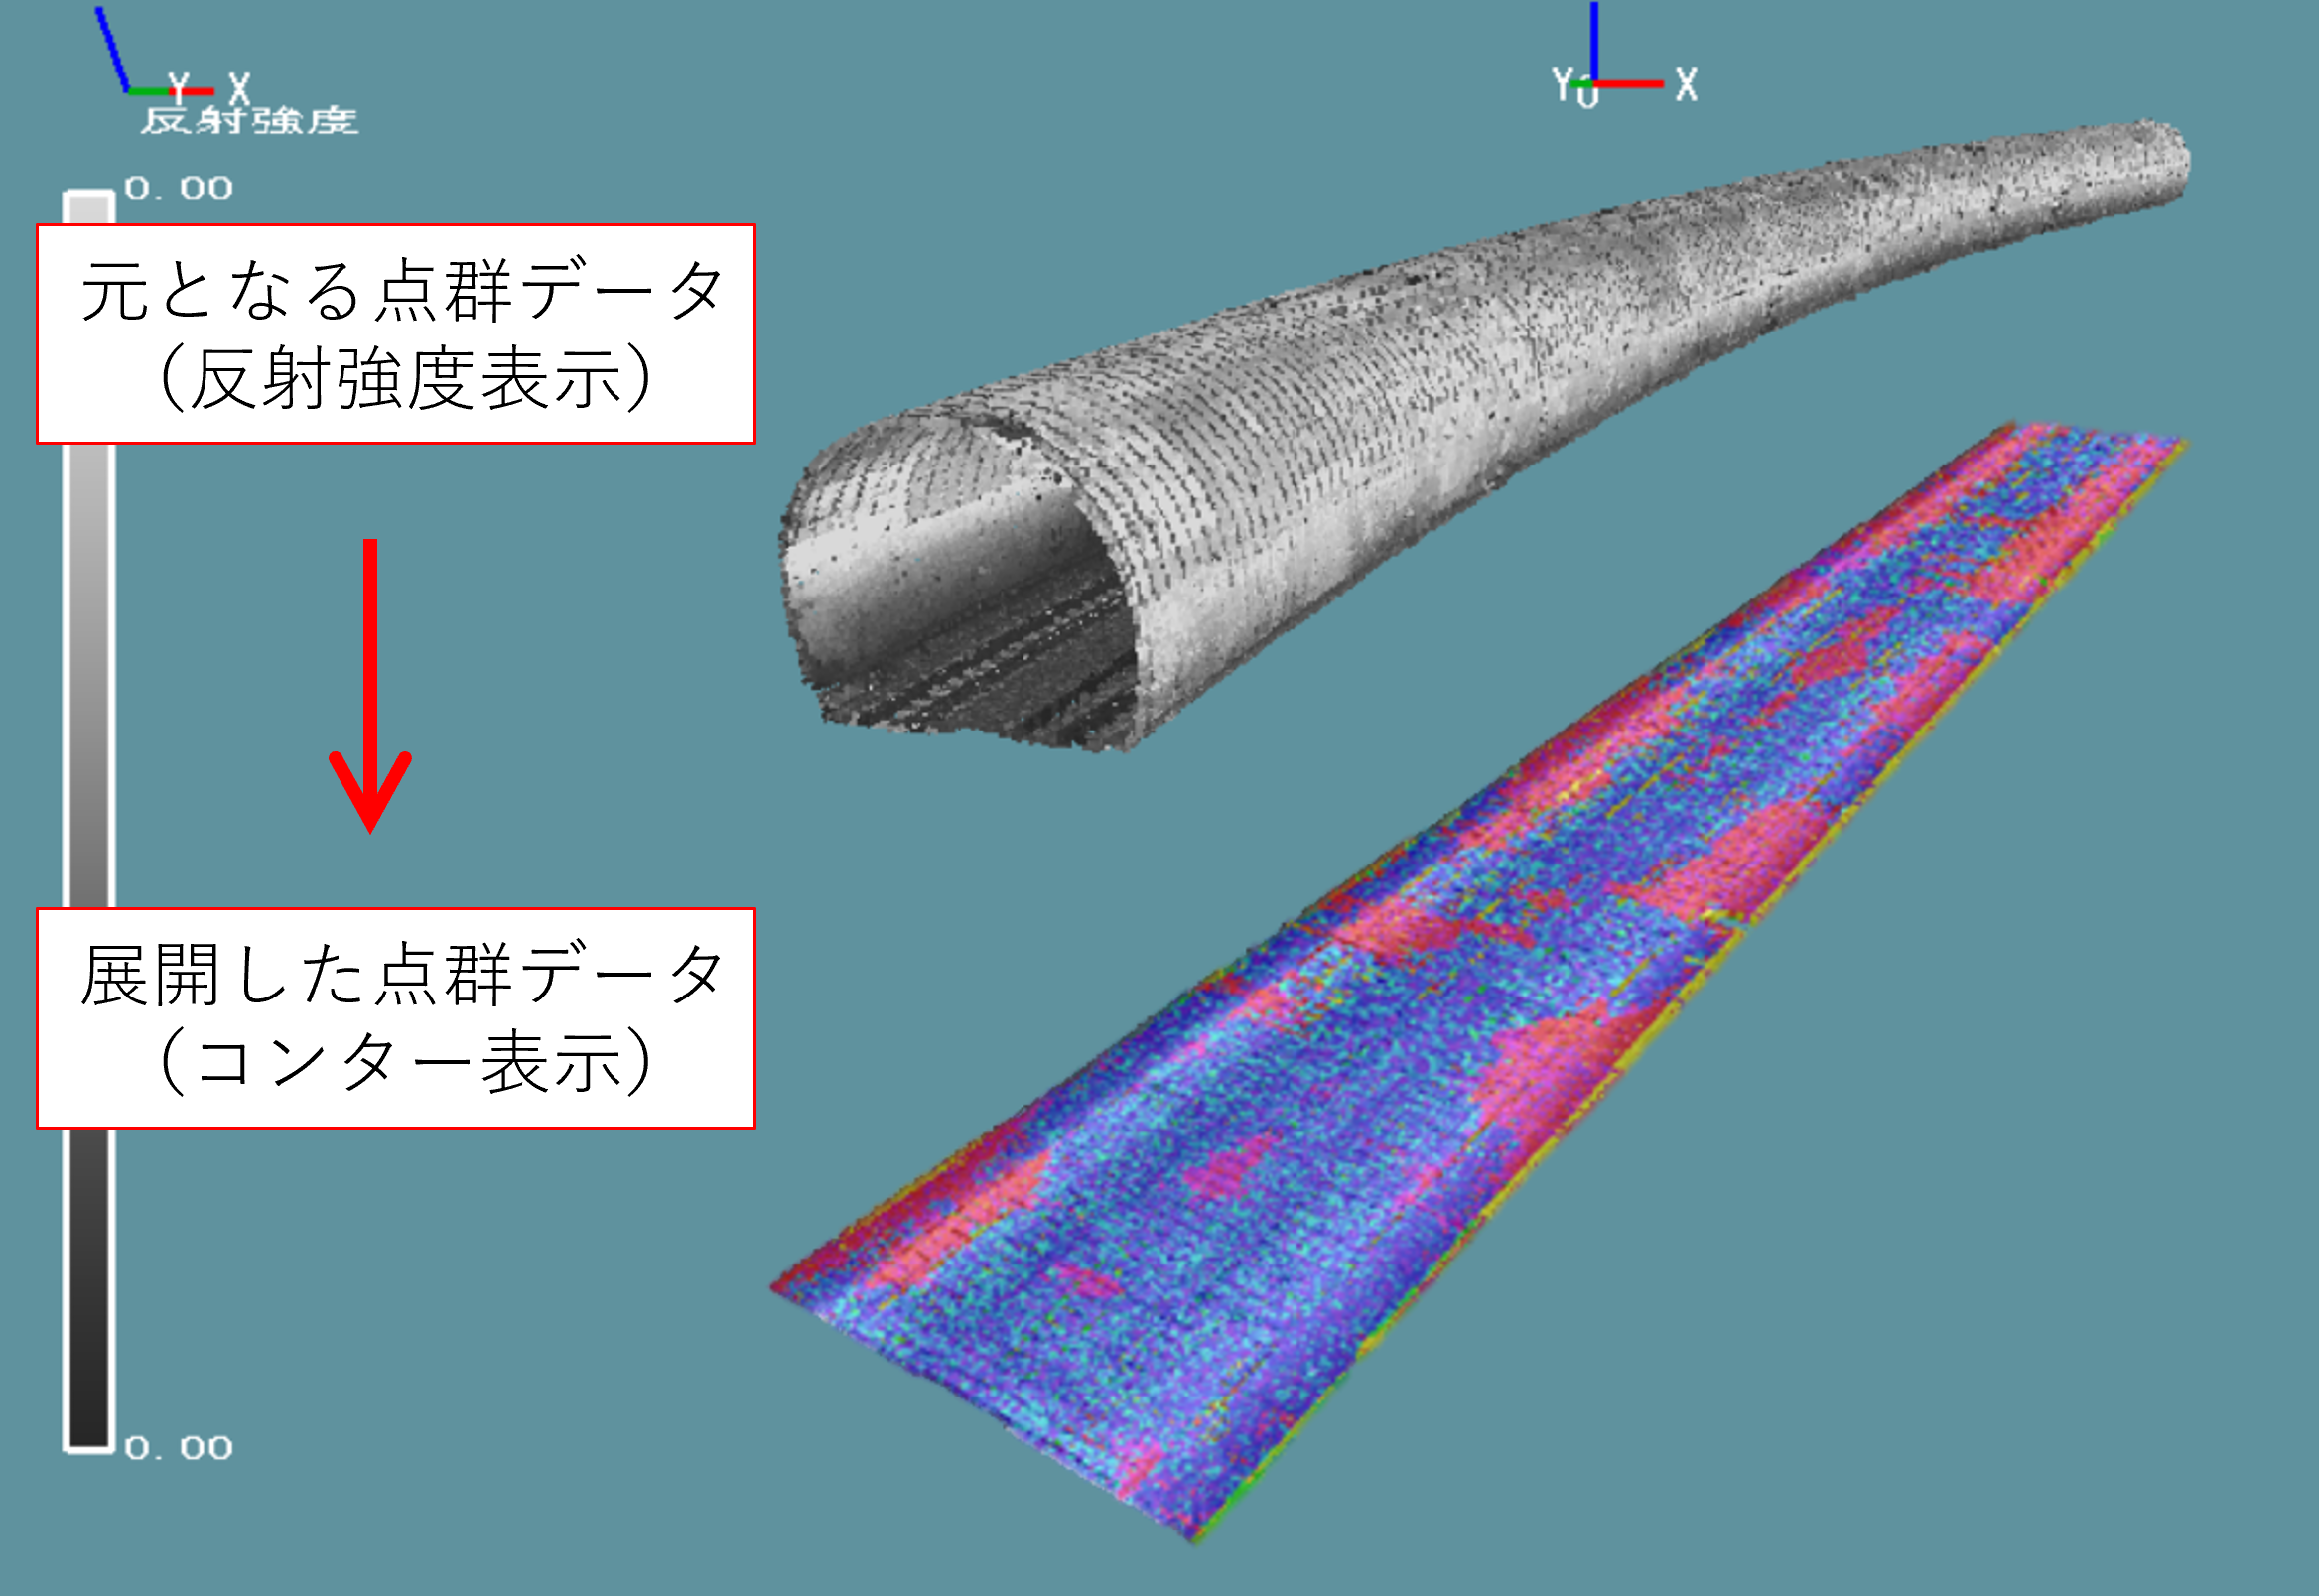
(Image 2) Color map display is also available
Drawing Creation Support (Creating existing drawings from point cloud data)
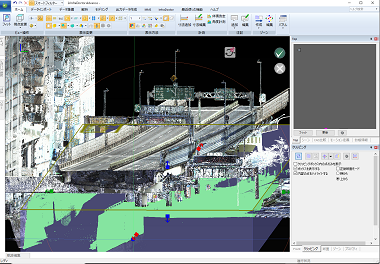
Import point cloud data into ADVANCE
Supports various data formats, including Las and Laz.
Limit the display range of the point cloud data
Use the clipping box or cross-section function.
Hide unnecessary parts of the point cloud
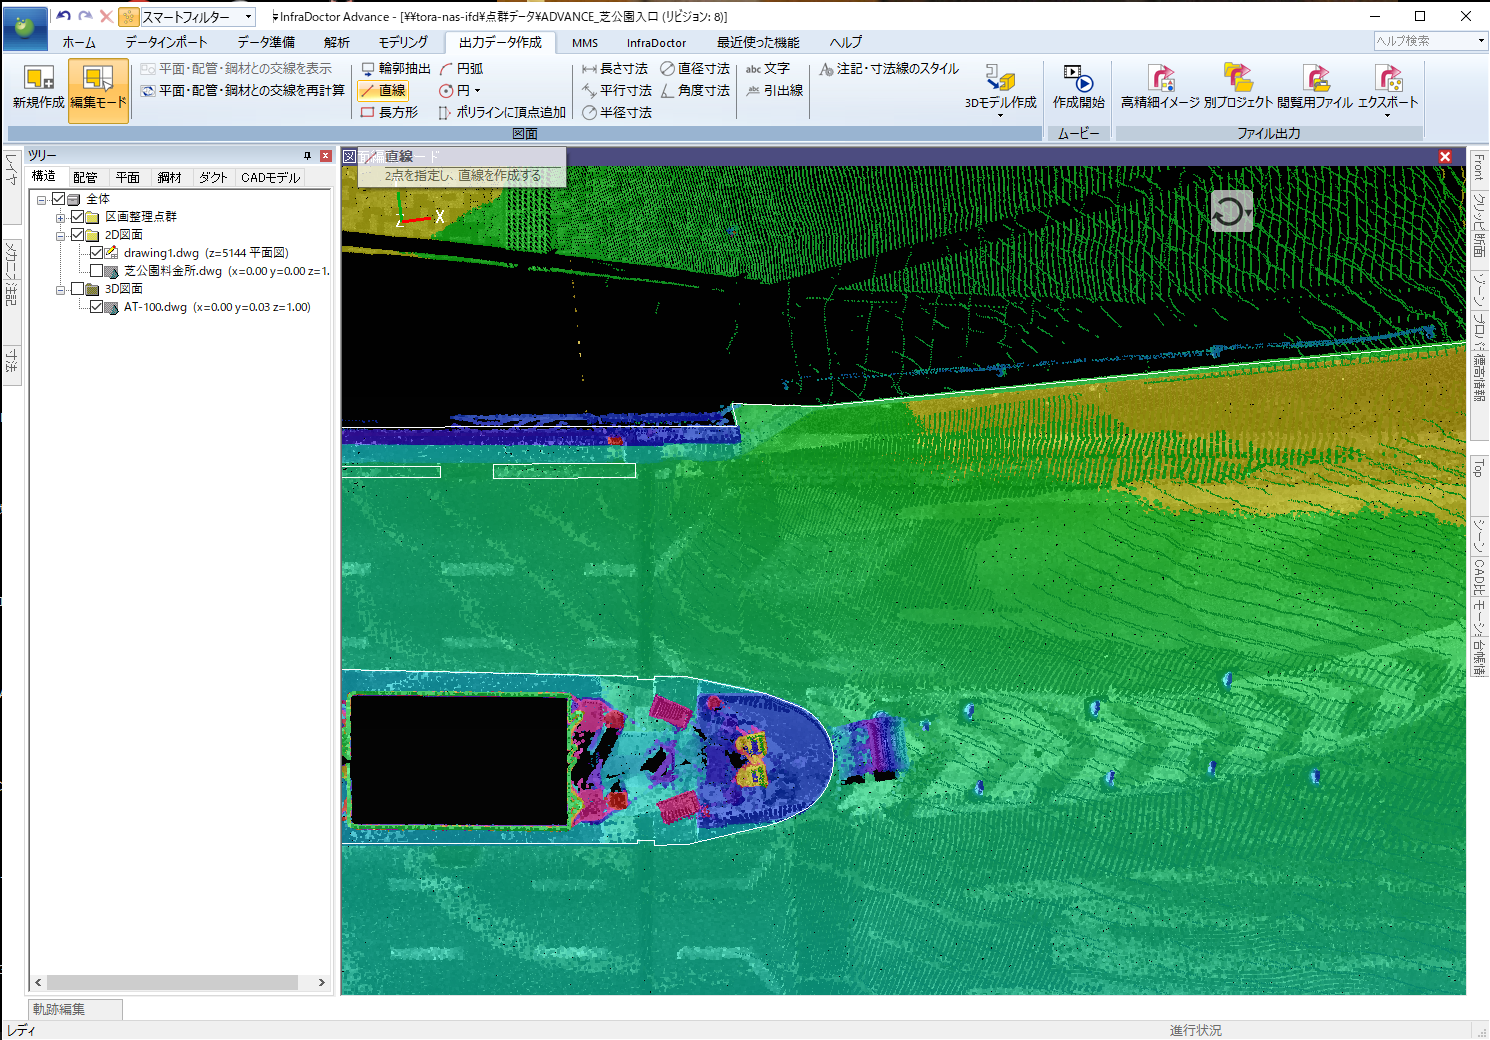
Display only the point clouds near the road surface and combine height display with reflection intensity to make it easier to distinguish lane markings and road structures.
Use the drawing function to trace white lines, curbs, etc.
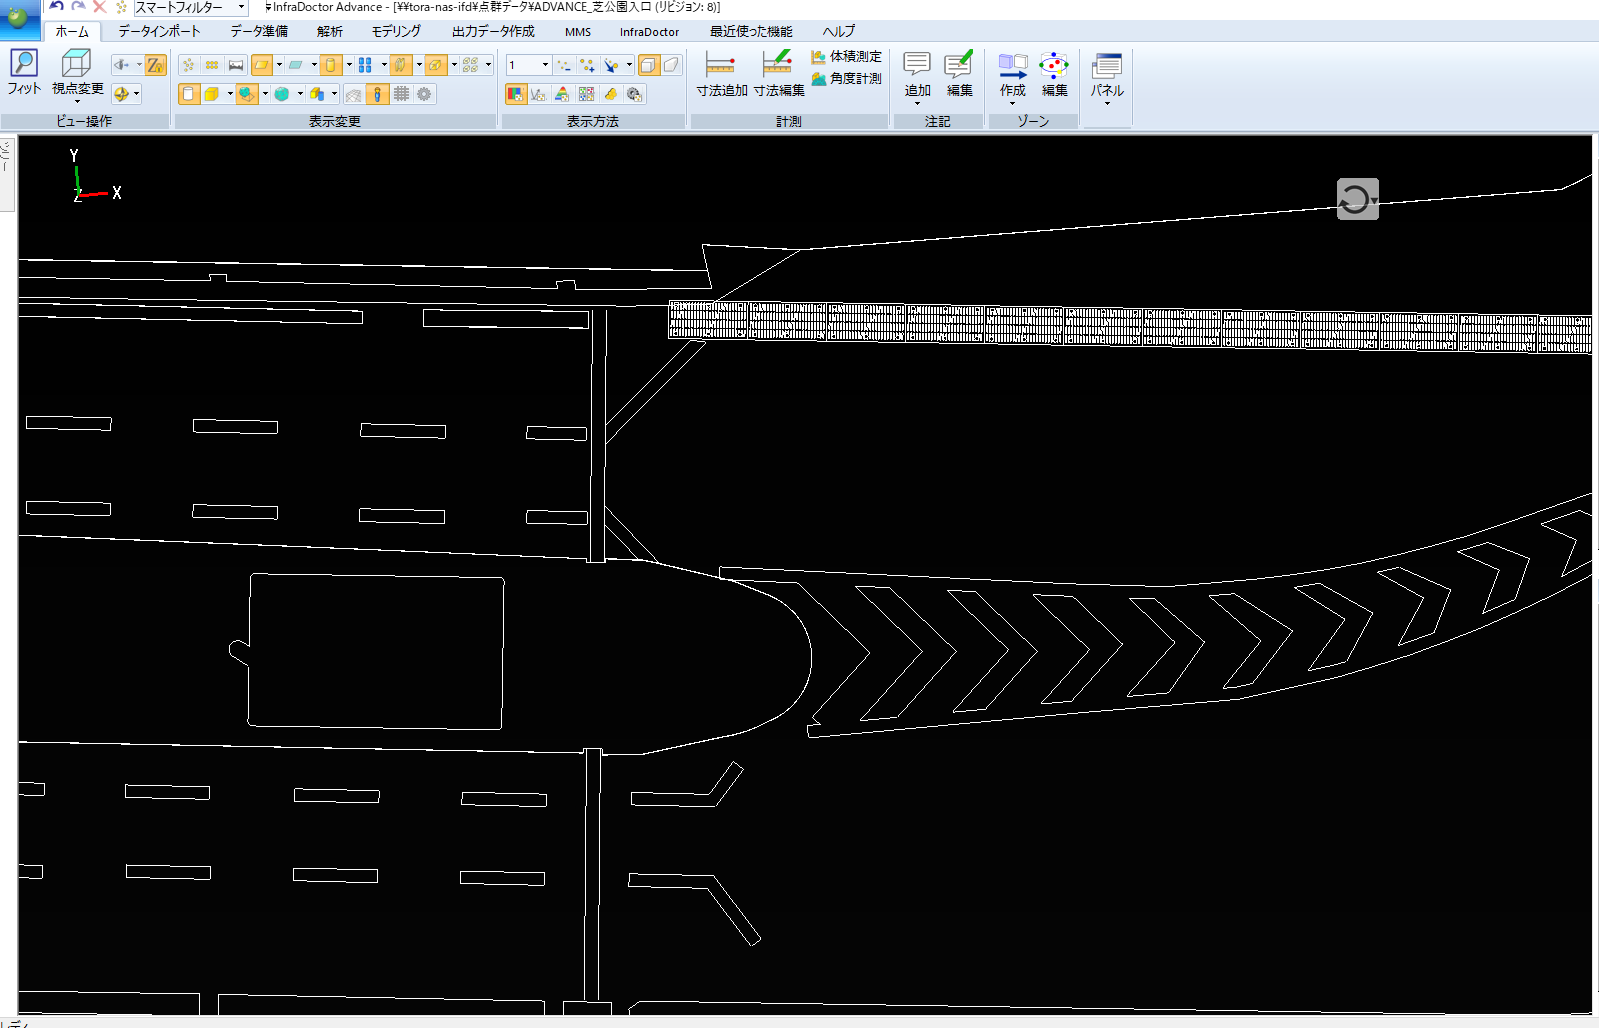
InfraDoctor®ADVANCE has a function to create drawings in DWG format. The DWG file created here can be exported and edited with CAD software. From the drawing editing mode, you can export a DWG file with a PNG image of the point cloud cross-section as the background. Lines and dimension lines drawn in ADVANCE are categorized into a separate layer from the background.
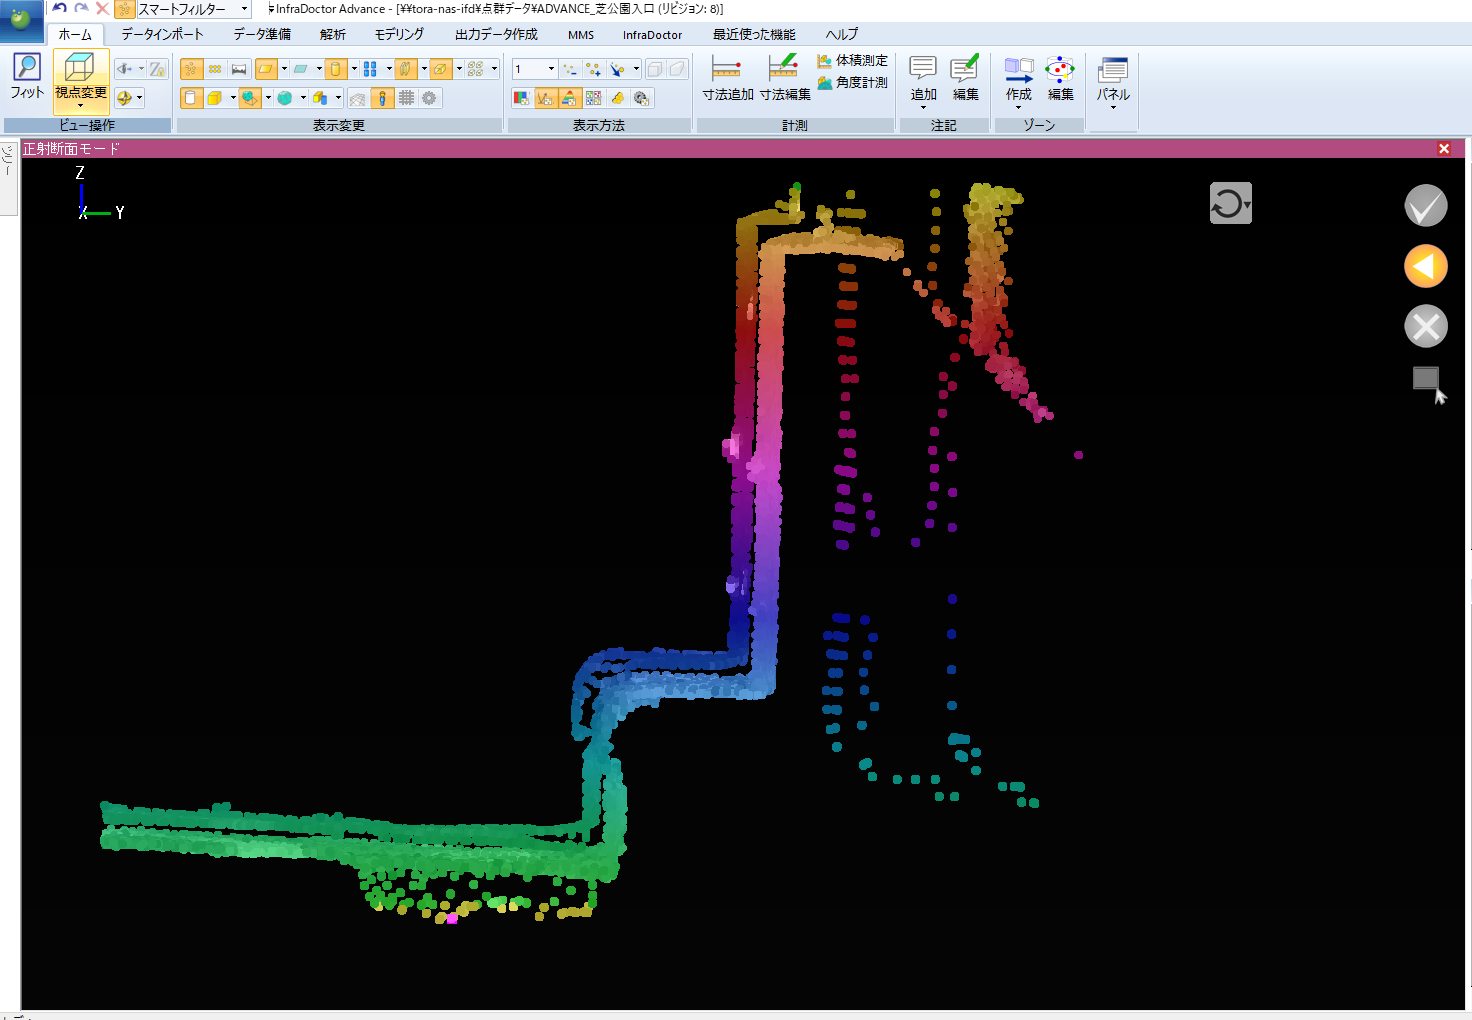
Create cross-sections to accurately grasp the shape
For areas that are difficult to judge with just the height display, creating cross-sections makes it easier and more accurate to understand the shape.
Finish the details quickly with CAD software
InfraDoctor®also has drawing functions that are similar to CAD software, but if you need a more detailed drawing, we recommend finishing it with the CAD software you are used to. You can export a DWG file with coordinate information, so you can easily import the finished drawing into the point cloud and display it.
Watch a video tutorial
Pavement Inspection and Road Surface Condition Survey

Acquire point cloud data and images of the road surface using MMS, etc.
Shutoko Engineering offers road surface condition surveys using point cloud data and image data.
Analyze the point cloud data
Mathematical analysis methods are used to calculate flatness and rutting from the point cloud data.
Analyze the image data
Cracks and patching are detected using AI from image data of the road surface.
Visualize the survey data
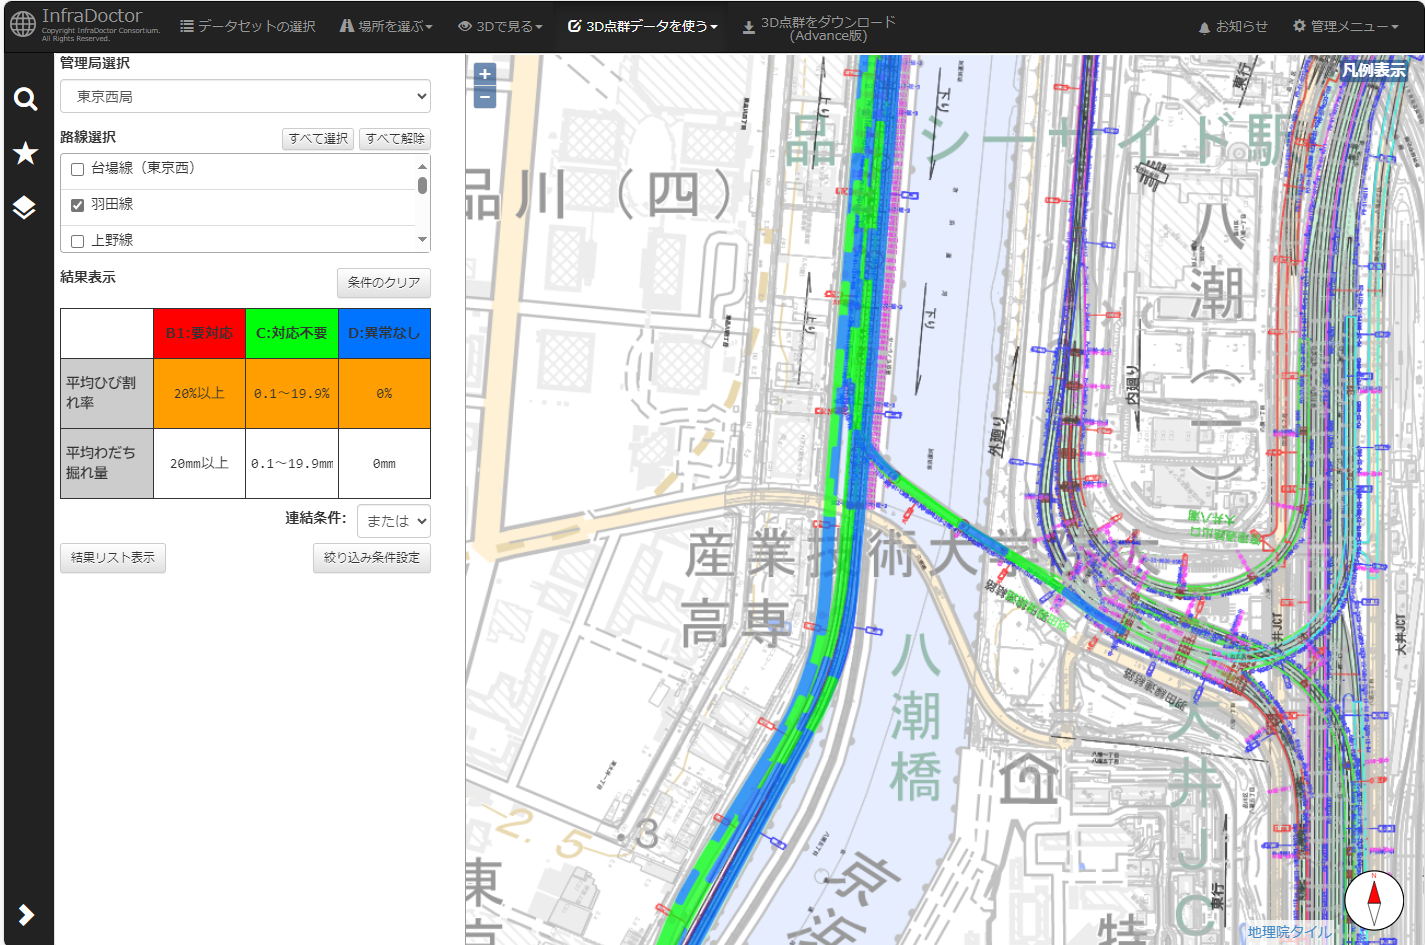
Survey data can be uploaded to InfraDoctor® WEB, and the survey results can be easily displayed on a GIS.
Data export
Survey data displayed on the GIS can be exported in Excel or CSV format.
Calculation of repair costs
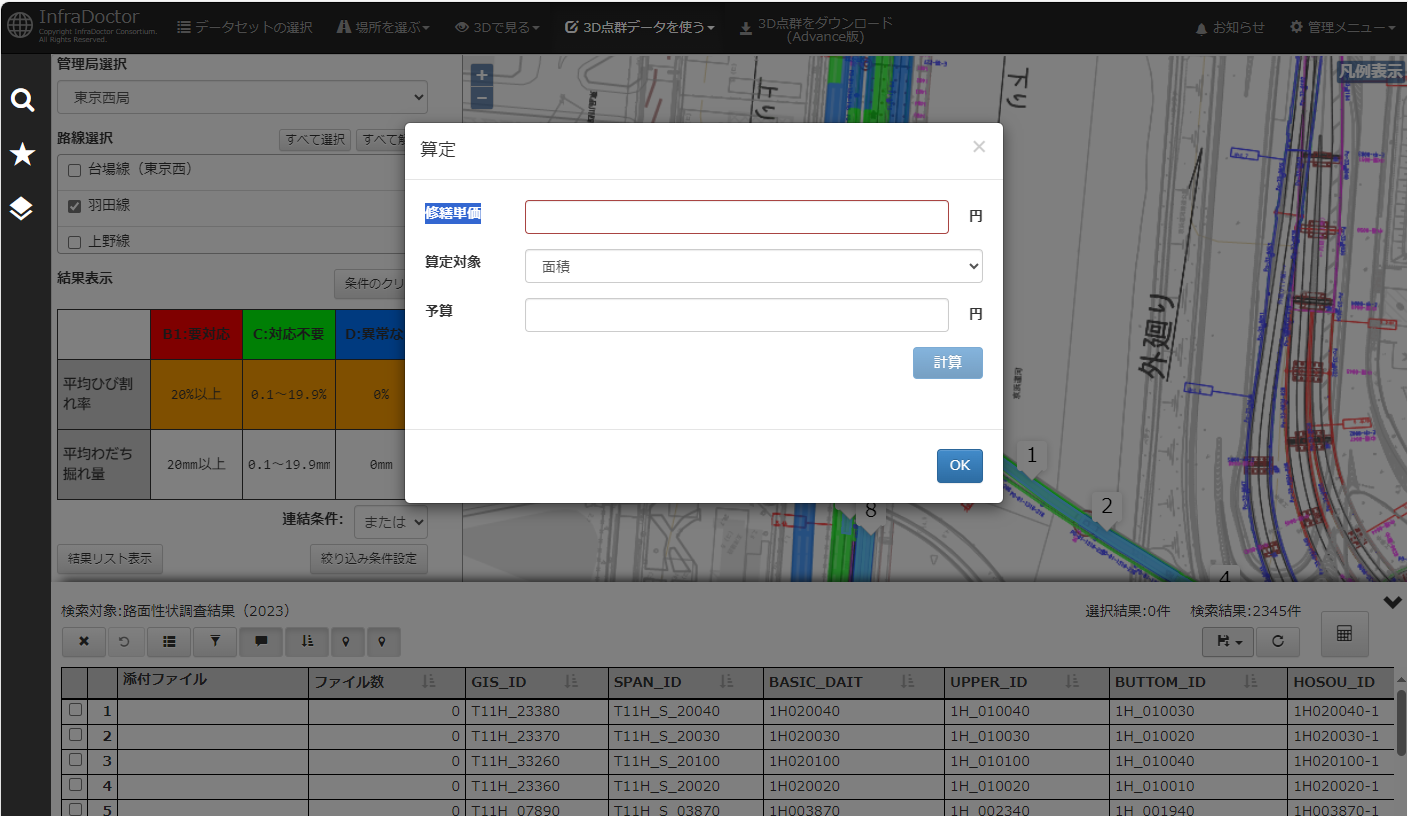
InfraDoctor®WEB is equipped with a function to calculate pavement repair costs.
Watch a video tutorial
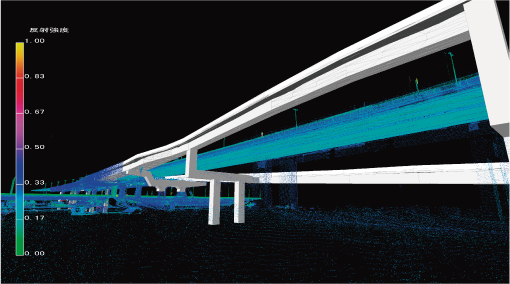
(Example 1) An example of creating a 3D model from a drawing, importing it into existing point cloud data, and confirming the finished shape.
3D Simulation
3D simulations can be performed using point cloud data.
InfraDoctor®ADVANCE imports 3D models into point cloud data to achieve more realistic simulations.
Video created with the motion function
The application also includes various models used for traffic control zones, allowing you to check how the control zones look from a driver's perspective.
You can create videos using the motion function.
Tunnel Inspection (Performance Catalog TN030013-V0023)
Tunnel Inspection
Tunnel inspection support using 3D point cloud data and image data with InfraDoctor®ADVANCE is listed in the performance catalog. (TN030013-V0023)
InfraDoctor®ADVANCE can visualize the uneven shape of the tunnel lining concrete surface as a color map based on 3D point cloud data (hereinafter, point cloud data) acquired by MMS (Mobile Mapping System), etc. By utilizing this software, you can estimate deformed areas such as "swelling and peeling." The method for visualizing the uneven shape of the lining concrete surface with this software is as follows.
- (1) Method for creating a reference surface: Approximate the point cloud data of the tunnel lining concrete surface to create a reference surface data. Calculate the difference between the created reference surface data and the point cloud data, and use this difference to create a color map of the uneven shape of the tunnel lining concrete surface.
- (2) Method for creating a reference cross-section: Specify an arbitrary cross-section from the tunnel's point cloud data to create reference cross-section data. While extruding the created reference cross-section data in the longitudinal direction of the tunnel, calculate the difference with the point cloud data and use this difference to create a color map of the uneven shape on the flattened point cloud data.
- (3) The detection results from (1) and (2) above are used in combination with image data captured during point cloud data acquisition to screen for areas with potential "swelling and peeling."
